Jet Reports Professional, is an Excel based reporting add-on that works with Microsoft Dynamics 365 Business Central. It’s a very powerful tool that also integrates with Excel functions, providing the capability to generate reports easily and quickly in the format you need.
In this blog I will look at the nested replicator in Jet Reports Professional. You will find out how nested replicators work and how they can help overcome the challenges of building complex reports that require extraction and filtering of data across multiple tables.
I will demonstrate the functionality by taking a Stock report (by Location and Lot No.) as an example.
Step 1. Use the NL (“Rows=x”) function as a replicator to list all the Item No. The x determines the number of blank rows to be inserted after each record.

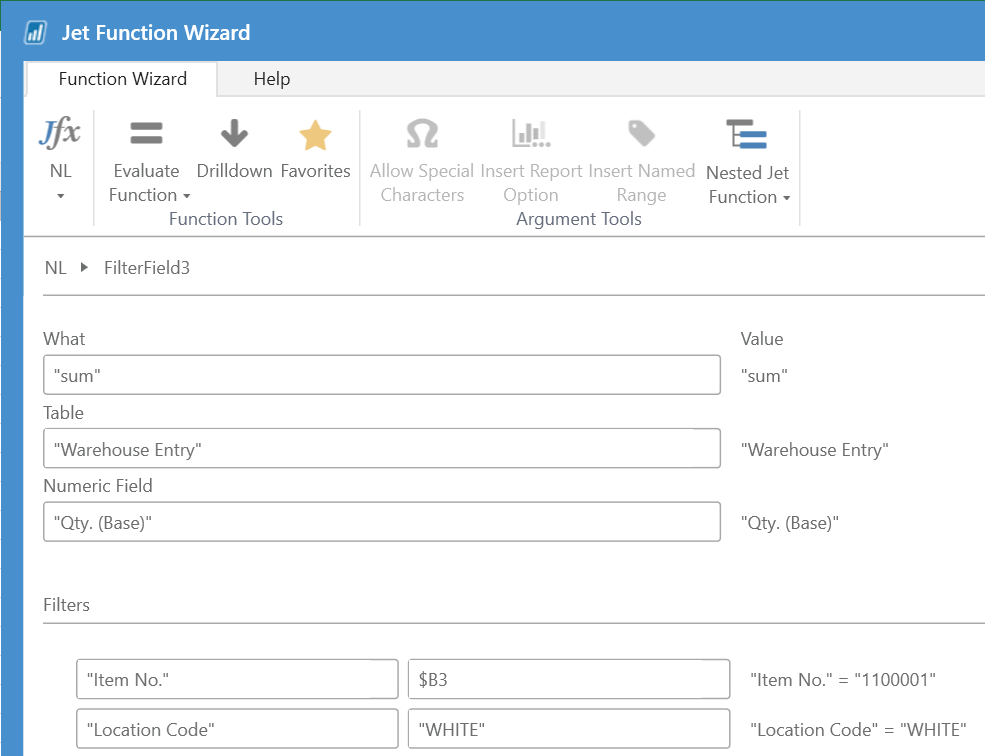
Step 2. Use the Jet reports sum function to get the inventory total for each item by location (cells C3, D3 and E3)

Step 3. Go to the next row and pull through the Item No. information from the row above.

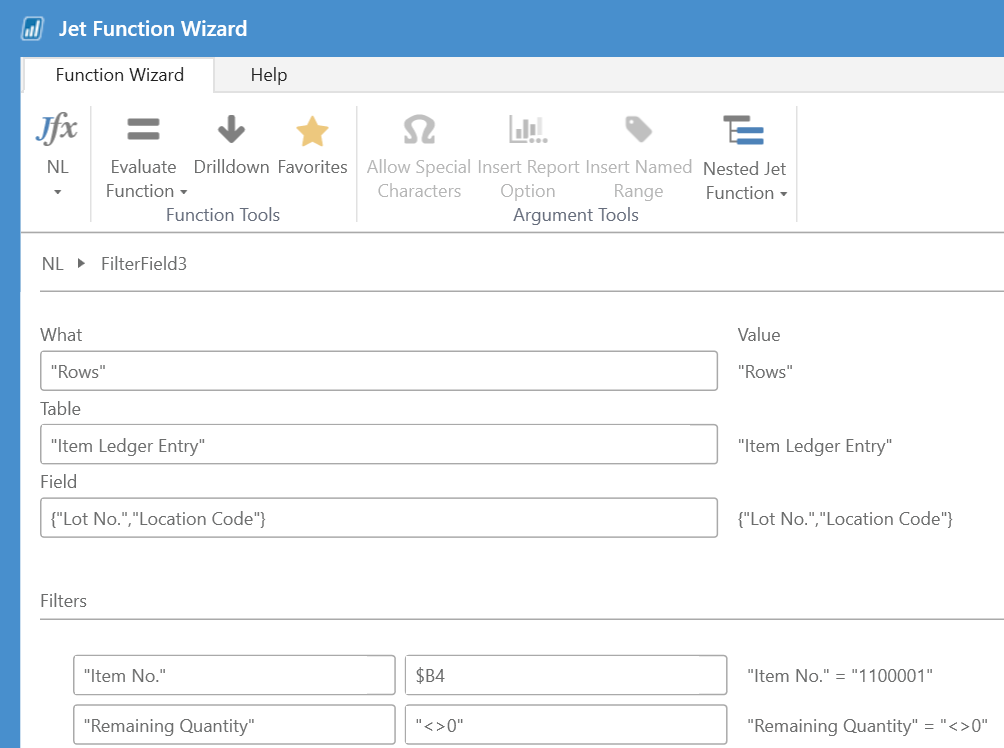
Step 4. Extract unique Lot No.s by location. You can create a key if you need to display multiple fields from a table.

Step 5. Use NF function to pull through the Lot No, Lot No. Location and Lot No. Qty.
The report is now done. You can refresh the report to see the result.
Note: any changes needed will need to be done while in the Design mode.
Was this article helpful?
This post was written by Jonathan Martin, COO at Evolution Business Systems.
His expertise extends to software development, support, implementations and project management, he can envisage potential problems and identify them to improve the client experience and outcomes, like a mad scientist, behaviour, statistics and data are where he gets his insights from and lives by a golden rule to always start at the beginning as there are no shortcuts. Jonathan’s passion is to make a difference by assisting clients with their business problems.

